Time series without time on an axis

Long ago I promised a post (to come quickly; apparently I lied) about this topic.

If we have time-series data, we typically put time on the horizontal axis. But that’s not the only way to represent something that changes in time. There is an alternative that’s closely related to parametric equations and graphs.

Consider this typical physics-class situation: you have a weight on a spring moving up and down. You can plot its position as a function of time. For regular old Hooke-ian springs where F = -kx , that will be a sinusoid.

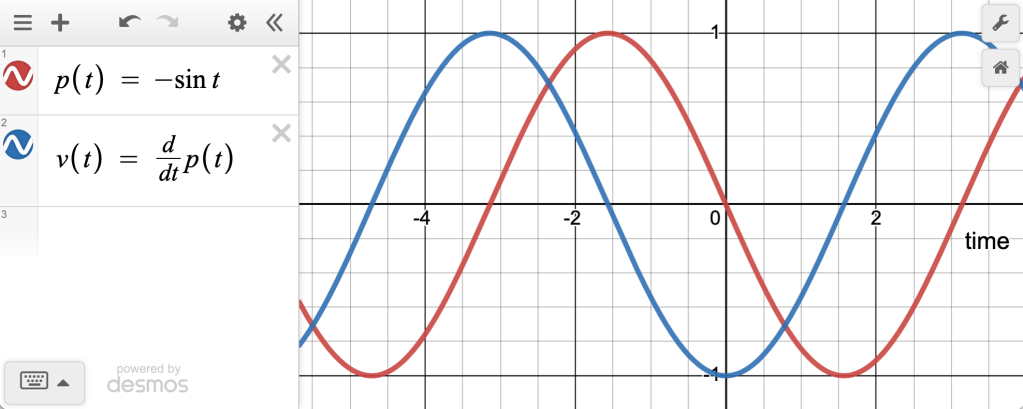
Now plot the velocity as a function of time. That will also be a sinusoid, but shifted by \frac{\pi}{2} , like this:

Position (red) and velocity (blue) for a weight on a spring. Or the bob of a pendulum. Or any number of things.

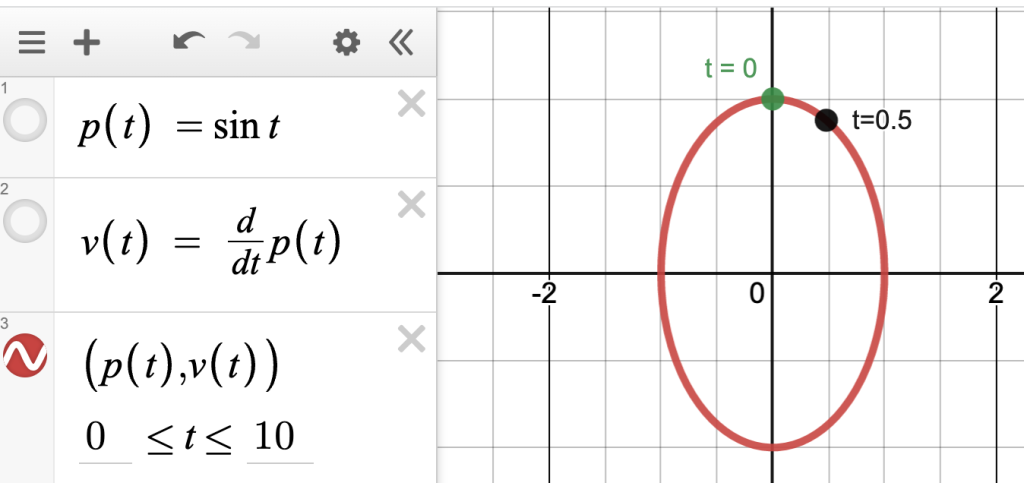
These are normal time-series functions, drawn with time on the horizontal axis. But as you may remember, you can instead plot them with the position on the x axis and velocity on the y , making a new point for every value of t :

Velocity (y) against position (x). Two points are labeled with time, showing that in this diagram, as time passes, the point moves in a clockwise direction.

There are many cool things about this, like what happens when the frequency of x is different from y , or when the delay is not 90°, and you get a wide variety of Lissajous figures. Or when you plot the velocity of a chaotic system against position…but that would be more of a digression than we want here.

Can we ever see this in real-world data, like, not from our imagination of a physics lab activity? Sure!

Here is one of my favorites, drawn from the “Blodgett” dataset available at codap.xyz. There we have air temperature in the Blodgett forest over the course of a year. We also have soil temperature. Here is one day of both plotted as traditional time series:
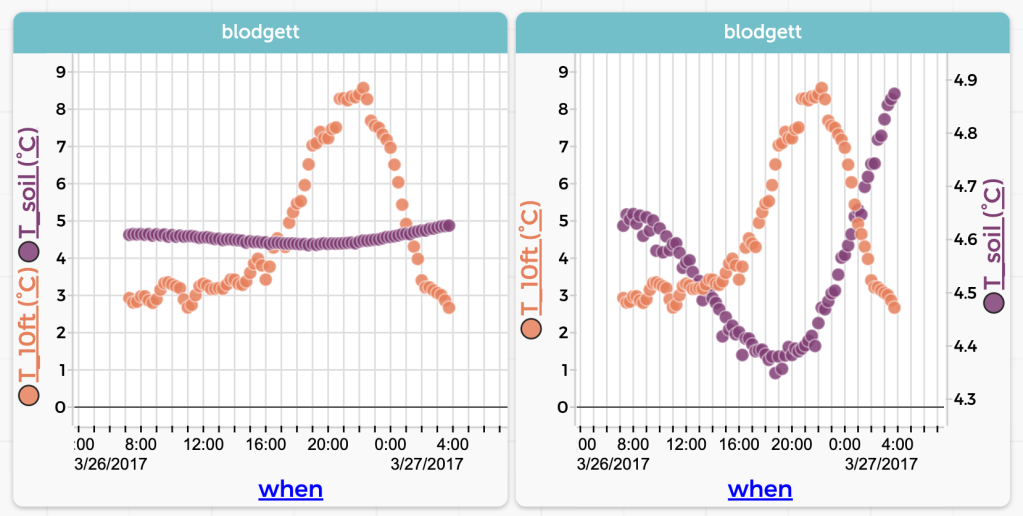
Air (orange) and soil (purple) temperatures for one day in March 2017. The left-hand graph uses the same scale for both.

Now here is the same data plotted with soil temperature on the vertical axis and air on the horizontal. In this plot, time is going counterclockwise:
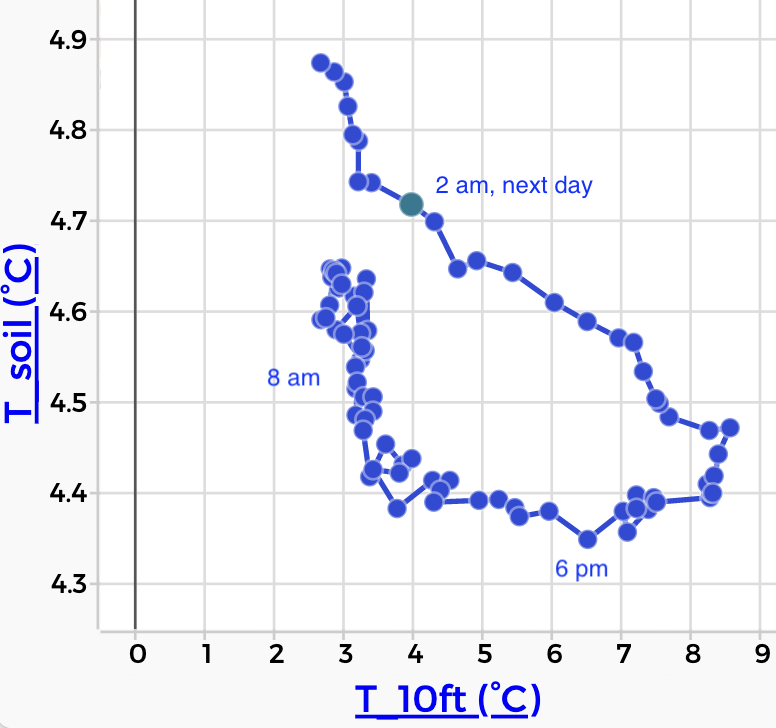
Soil versus air temperature. Time increases as you travel counterclockwise around the loop.

If you’re like me, that graph does not immediately shout what’s going on. But with some practice, we realize that the shape of the loop tells us about the delay between the air temperature and the soil temperature.

The point being, there are more ways in heaven and earth [Horatio] to display time series. Usually, of course, stick time on the horizontal. But be open to intriguing alternatives.

Letter Frequencies (and more) in Wordle

Let’s assume you already know about Wordle. As you may know, Wordle uses a curated list of five-letter words. For example, it doesn’t include plurals of four-letter nouns (no BOOKS) or past tenses ending in ED (no TIMED). The list is easily discoverable online, at least I discovered one and maybe it’s the one used in the puzzle. You can see it in this CODAP document.

But this blog is about data, so that’s where we’re going. You know from growing up with (or learning) English that E is the most common letter. You might even remember a mnemonic such is ETAOIN SHRDLU that’s supposed to represent the top dozen letters by frequency. I once learned ETAONRISH for the same purpose. These listings are not the same! How could that be?

Read more: Letter Frequencies (and more) in Wordle

Of course, it’s because they must have been compiled from different sources of text. Consider: suppose Blanziflor uses the words in a dictionary, while Helena uses the text of today’s New York Times. Helena might have more T, H, and E than Blanziflor simply because THE appears many times in her text but only once in Blanziflor’s.

So it might be interesting to look at letter frequencies in the “Wordle corpus,” if only to get an idea of which letters to try to fit into your next guess.

So, for your exploration and enjoyment, here is a CODAP document (same link as above) with “my” Wordle list, broken down into individual letters using the “texty” plugin.

I get EAROT LISNC UY for the top twelve. See the graph at the top of this post.

To make that graph in CODAP, I grouped the data by letter, then made a new attribute to count() the number of appearances of each letter. That’s kind of an “intermediate” CODAP task with very little explanation; see if you can figure out how to do it.

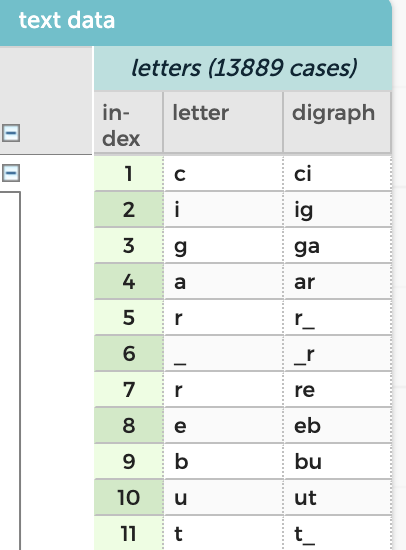
The analysis also includes digraphs, that is, all the two-letter sequences, with the underscore “_” standing in for a space. So in the table below you see r_ (case 6) containing the last letter in CIGAR and _r (case 7) with the first letter in REBUT.

An interesting question here might be something like, “J is the least common letter. How many times does it appear? Is it always the first letter of the word?”

One more thing: is this cheating? Reasonable people can disagree; here’s how I draw that line: writing a version of WordleBot for personal use is an interesting programming challenge, but would be cheating for actually doing Wordle. Searching the word list using regular expressions is a no-no for sure. I think that looking at the word list while doing Wordle is still cheating, at least a little. But having looked at the word list is OK. Likewise, learning the frequencies of letters, I think, is OK: it’s enhanced common sense. It does not use the power of computing to be systematic and exhaustive.

Time Series! Smoothing and COVID (and folding, too)

Welcome to the third in a soon-to-end series in which I figure out what I think about time series data, and how it is different from the data we usually encounter in school assignments. We’re exploring what tools and techniques we might use with time series that we don’t traditionally cover in stats or science, and wondering whether maybe we should. For me and my CODAP buddies, it also raises the question of whether a tool like CODAP should have more built-in support for time series.

Smoothing

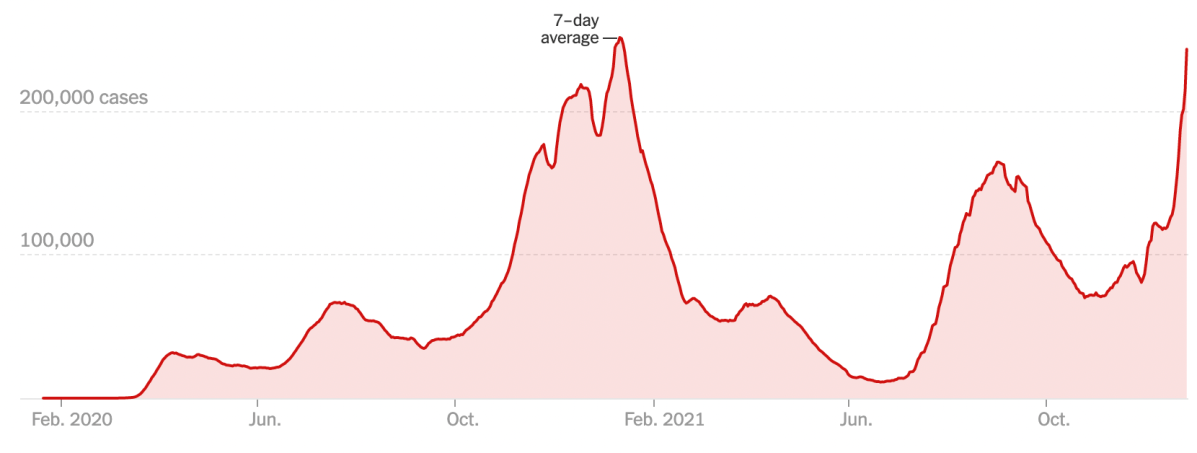
One of these tools is smoothing. There is smoothing (for example Loess smoothing) for other, non-function-y data, but smoothing is easier to understand with time series (or any other data that’s fundamentally a function; the previous post in this series explains this obsession with functions).

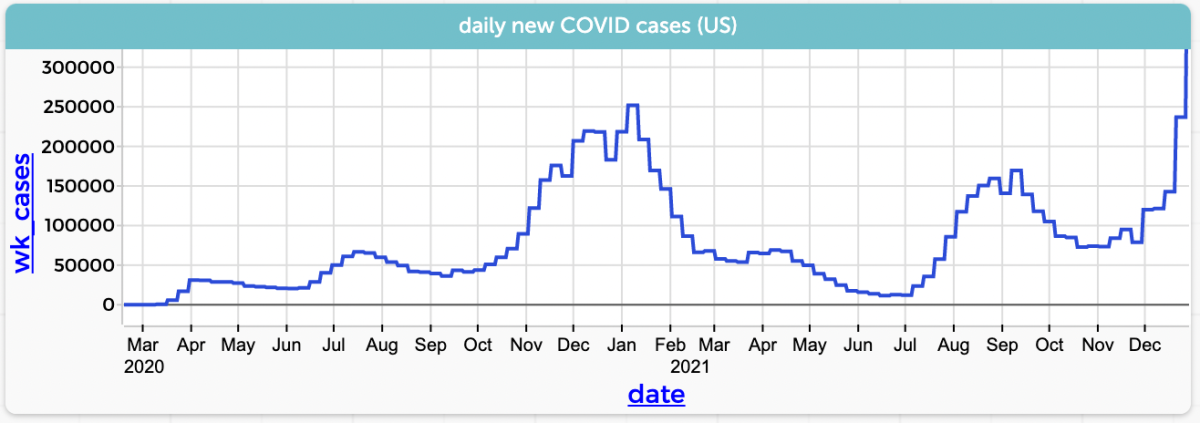
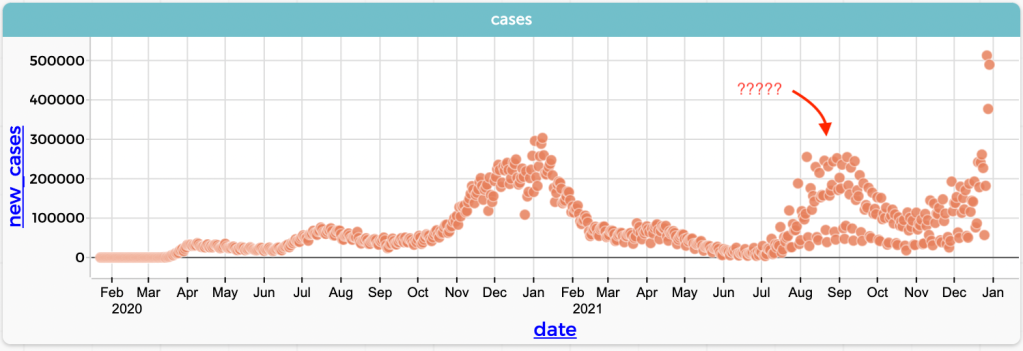
Since it’s December 2021, let’s stick with COVID and look at the number of new cases in the US by day (CODAP file here):

Daily newly reported COVID cases in the US. Data from https://ourworldindata.org/.
Graph in CODAP
Continue reading “Time Series! Smoothing and COVID (and folding, too)”

Time Series and Modeling

The second in a sequence of posts about time series. Here is the first one.

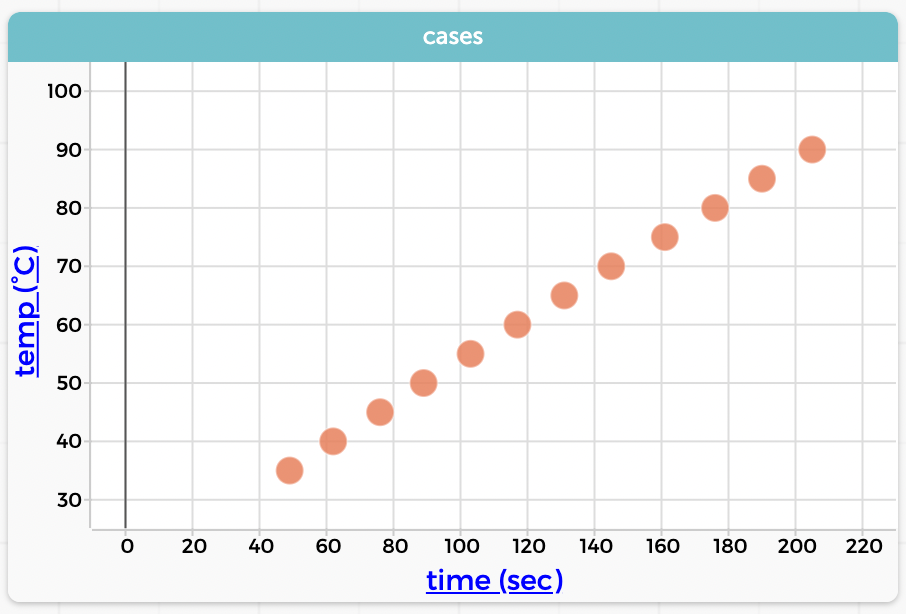
Students in traditional stats, as well as in science and math classes, learn linear modeling in the sense of finding a straight line that fits some data. Suitable data are often (but not always) time series: some phenomenon is increasing or decreasing regularly with time; you take repeated measurements; you plot the values against time; et voilà! A linear relationship.

Here is a data set I’ve used before. I put a pot of water on the stove, stuck a thermometer in the water, and turned on the flame. I recorded the time whenever the temperature passed another five degrees Celsius.

The author heated water on a stove. Graph in CODAP. We could clearly connect these dots with lines, and it would make sense.
Continue reading “Time Series and Modeling”

Thinking about Teaching and Time Series

Time series data shows the same phenomenon taken at different times. It’s possible, therefore, to plot the data—traditionally with time on the horizontal axis—and see how the data values change with time. As in the “banner” graph above.

The graph tells a story; and we read it chronologically from left to right. As experienced graph-readers, we see the surges and dips in COVID cases, as well as the vertical omicron rise (and as of this writing we have no idea what will happen!).

Continue reading “Thinking about Teaching and Time Series”

How can you be awash in data? Let me count the ways.

Three.

I oversimplify, of course, but this is what I’m thinking about; and this came as a result of attending an advisory meeting about a cool project called Data Clubs. And as usual for this blog, we are using CODAP.

Continue reading “How can you be awash in data? Let me count the ways.”

Flowers! Phi! Codap!

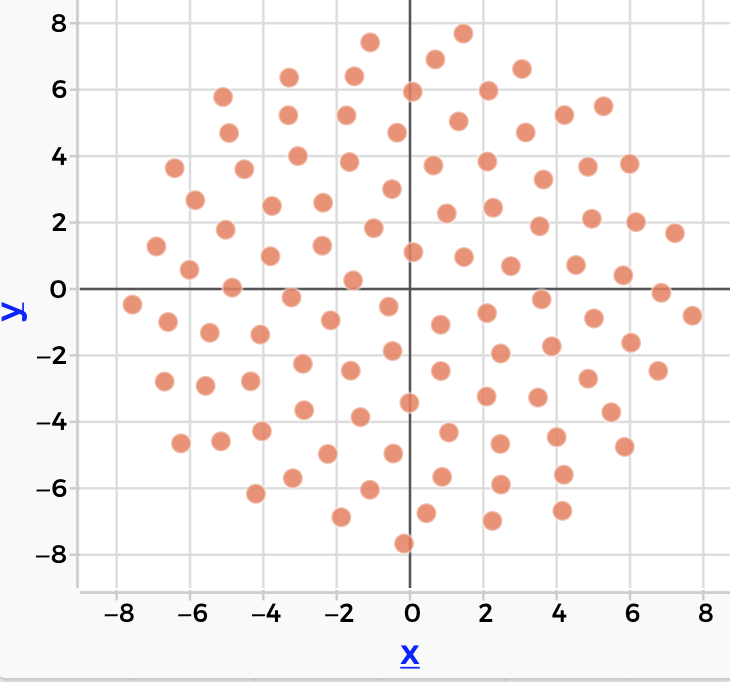
Okay, something very short, with thanks to Avery Pickford: How do sunflowers organize their seeds? Why is phi the most irrational number? How are these two questions connected, and how can we model that in CODAP?

Here is the YouTube video from Numberphile that inspired it. Worth a watch.

And here is a CODAP document:
 https://codap.concord.org/releases/latest/static/dg/en/cert/index.html#shared=149141

Weather Models Reflection

Last time I described an idea about how to use matrices to study simple weather models. Really simple weather models; in fact, the model we used was a two-state Markov system. And like all good simple models, it was interesting enough and at the same time inaccurate enough to give us some meat to chew on.

I used it as one session in a teacher institute I just helped present (October 2019), where “matrices” was the topic we were given for the five-day, 40-contact-hour event. Neither my (excellent!) co-presenter Paola Castillo nor I would normally have subjected teachers to that amount of time, and we would never have spent that much time on that topic. But we were at the mercy of people at a higher pay grade, and the teachers, whom we adore, were great and gamely stuck with us.

One purpose I had in doing this session was to show a cool use for matrices that had nothing to do with solving systems of linear equations (which is the main use they have in their textbook).

Some takeaways:

  • Just running the model and recording data was fun and very important. Teachers were unfamiliar with the underlying idea, and although a few immediately “got it,” others needed time just to experience it.
  • Making the connection between the randomness in the Markov model and thinking about natural frequencies did not appear to cause any problem. I suspect that this was not an indication of understanding, but rather a symptom of their not having had enough time with it to realize that they had a right to be confused.
  • The diagram of the model was confusing.

Let’s take the last bullet first. The model looked like this:

Our two-state Markov weather model. Use one die to update today’s weather to tomorrow’s.
Continue reading “Weather Models Reflection”

Weather Models and Matrices

Ack! I don’t have time to do justice to this right now, but any readers need to know if you don’t already that the geniuses at Desmos seem to be making a matrix calculator: https://www.desmos.com/matrix.

Having read that, you might rightly say, I can’t get to everything in my curriculum as it is, why are you bringing up matrices? (You might also say, Tim, I thought you were a data guy, what does this have to do with data?)

Let me address that first question (and forget the second): I’m about to go do a week of inservice in a district that, for reasons known only to them, have put matrices in their learning goals for high-school math. Their goal seems to be to learn procedures for using matrices to solve systems of linear equations.

I look at that and think, surely there are more interesting things to do with matrices. And there are!

Continue reading “Weather Models and Matrices”

Sometimes, articles get done

Back in 2017, I gave a talk in which I spoke of “data moves.” These are things we do to data in order to analyze data. They’re all pretty obvious, though some are more cognitively demanding than others. They range from things like filtering (i.e., looking at a subset of the data) to joining (making a relationship between two datasets). The bee in my bonnet was that it seemed to me that in many cases, instructors might think that these should not be taught because they are not part of the curriculum—either because they are too simple and obvious or too complex and beyond-the-scope. I claimed (and still claim) that they’re important and that we should pay attention to them, acknowledge them when they come up, and occasionally even name them to students and reflect explicitly on how useful they are.

Of course there’s a great deal more to say. And because of that I wrote, with my co-PI’s, an actual, academic, peer-reviewed article—a “position paper”; this is not research—describing data moves. Any of you familiar with the vagaries of academic publishing know what a winding road that can be. But at last, here it is:

Erickson, T., Wilkerson, M., Finzer, W., & Reichsman, F. (2019). Data Moves. Technology Innovations in Statistics Education, 12(1). Retrieved from https://escholarship.org/uc/item/0mg8m7g6.

Then, in the same week, a guest blog post by Bill Finzer and me got published. Or dropped, or whatever. It’s about using CODAP to introduce some data science concepts. It even includes figures that are dynamic and interactive. Check out the post, but stay for the whole blog, it’s pretty interesting:

https://teachdatascience.com/codap/

Whew.