
Trying to get yesterday’s post out quickly, I touched only lightly on how to set up the various simulations. So consider them exercises for the intermediate-level simulation maker. I find it interesting how, right after a semester of teaching this stuff, I still have to stop and think how it needs to work. What am I varying? What distribution am I looking at? What does it represent?
Seeing how the two approaches fit together, yet are so different, helps illuminate why confidence intervals can be so tricky.
Anyway, I promised a Very Compelling Real-Life Application of This Technique. I had thought about talking to fisheries people, but even though capture/recapture somehow is nearly always introduced in a fish context, of course it doesn’t have to be. Here we go:
Human Rights and Capture/Recapture
I’ve just recently been introduced to an outfit called the Human Rights Data Analysis Group. Can’t beat them for statistics that matter, and I really have to say, a lot of the explanations and writing on their site is excellent. If you’re looking for Post-AP ideas, as well as caveats about data for everyone, this is a great place to go.
One of the things they do is try to figure out how many people get killed in various trouble areas and in particular events. You get one estimate from some left-leaning NGO. You get another from the Catholics. Information is hard to get, and lists of the dead are incomplete. So it’s not surprising that different groups get different estimates. Whom do you believe?
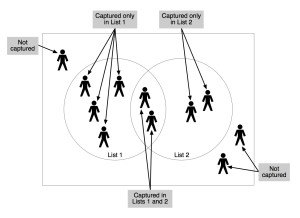 Suppose the LLNGO thinks that 20 civilians were killed during a protest. They give you a list of the victims. As the same time, the Catholics think that 25 civilians were killed. They have a list too.
Now the key thing: you compare the lists. Suppose the lists have five names in common. Now you’re super confident that at least 40 people were killed, because you have 40 names. But when you think about it, this is exactly the same as capture/recapture—and you can calculate that it’s likely that 100 people were killed.
And this, at root, is how these folks actually make better estimates for the effects of tyranny, torture, war crimes, and other institutionalized misconduct around the world. But only at root. The techniques get more sophisticated in interesting ways that I’m only starting to understand.
For example, one problem with what I just described is the same as when we get realistic about the fish. Why should we assume that every fish in the lake, tagged or untagged, has the same probability of getting caught?
In the human-rights context, this issue is called list independence. That is, do the LLNGO and the Catholics have the same chance of listing each person killed? Of course not. Relatives who might talk to the Catholics might not even speak to the LLNGO, and vice versa. Or they might have been doing their counts in different geographical parts of the protest.
It turns out that, using techniques that seem to be called MSE for Multiple Systems Estimation, you can try to account for list independence and other potential problems, provided you have three or more lists. I’m intrigued to study up on this and learn more, and you can too! Here is the first of a series of blog posts by Amelia Hoover Green. Follow the links to the next chapters. See what you think.
Meanwhile, think about one of the overarching problems from the last post: that the population estimate was so wide. I think that part of the problem is that when my brain is stuck in the fish context, I think it’s impractical to imagine tagging, say, half of the fish in the lake. But you can see from the graphs (and common sense) that if the fraction tagged is small, and the numbers are kind of small, the resulting distributions will be wide and sparse.

But in this context, we probably start out with the (wrong) assumption that we have almost all of the deaths; so our estimates will be better.
This graph shows estimates of population with, again, a true population of 100, but this time with half of the fish—50 cases—captured and tagged, and 50 recaptured. This is equivalent to each (independent) list having 50 casualties, with varying numbers of names (centered on 25) overlapping.
Notice how the interval has shrunk: it’s now (80, 135) instead of (60, 200).

One thought on “Capture/Recapture Part Two”